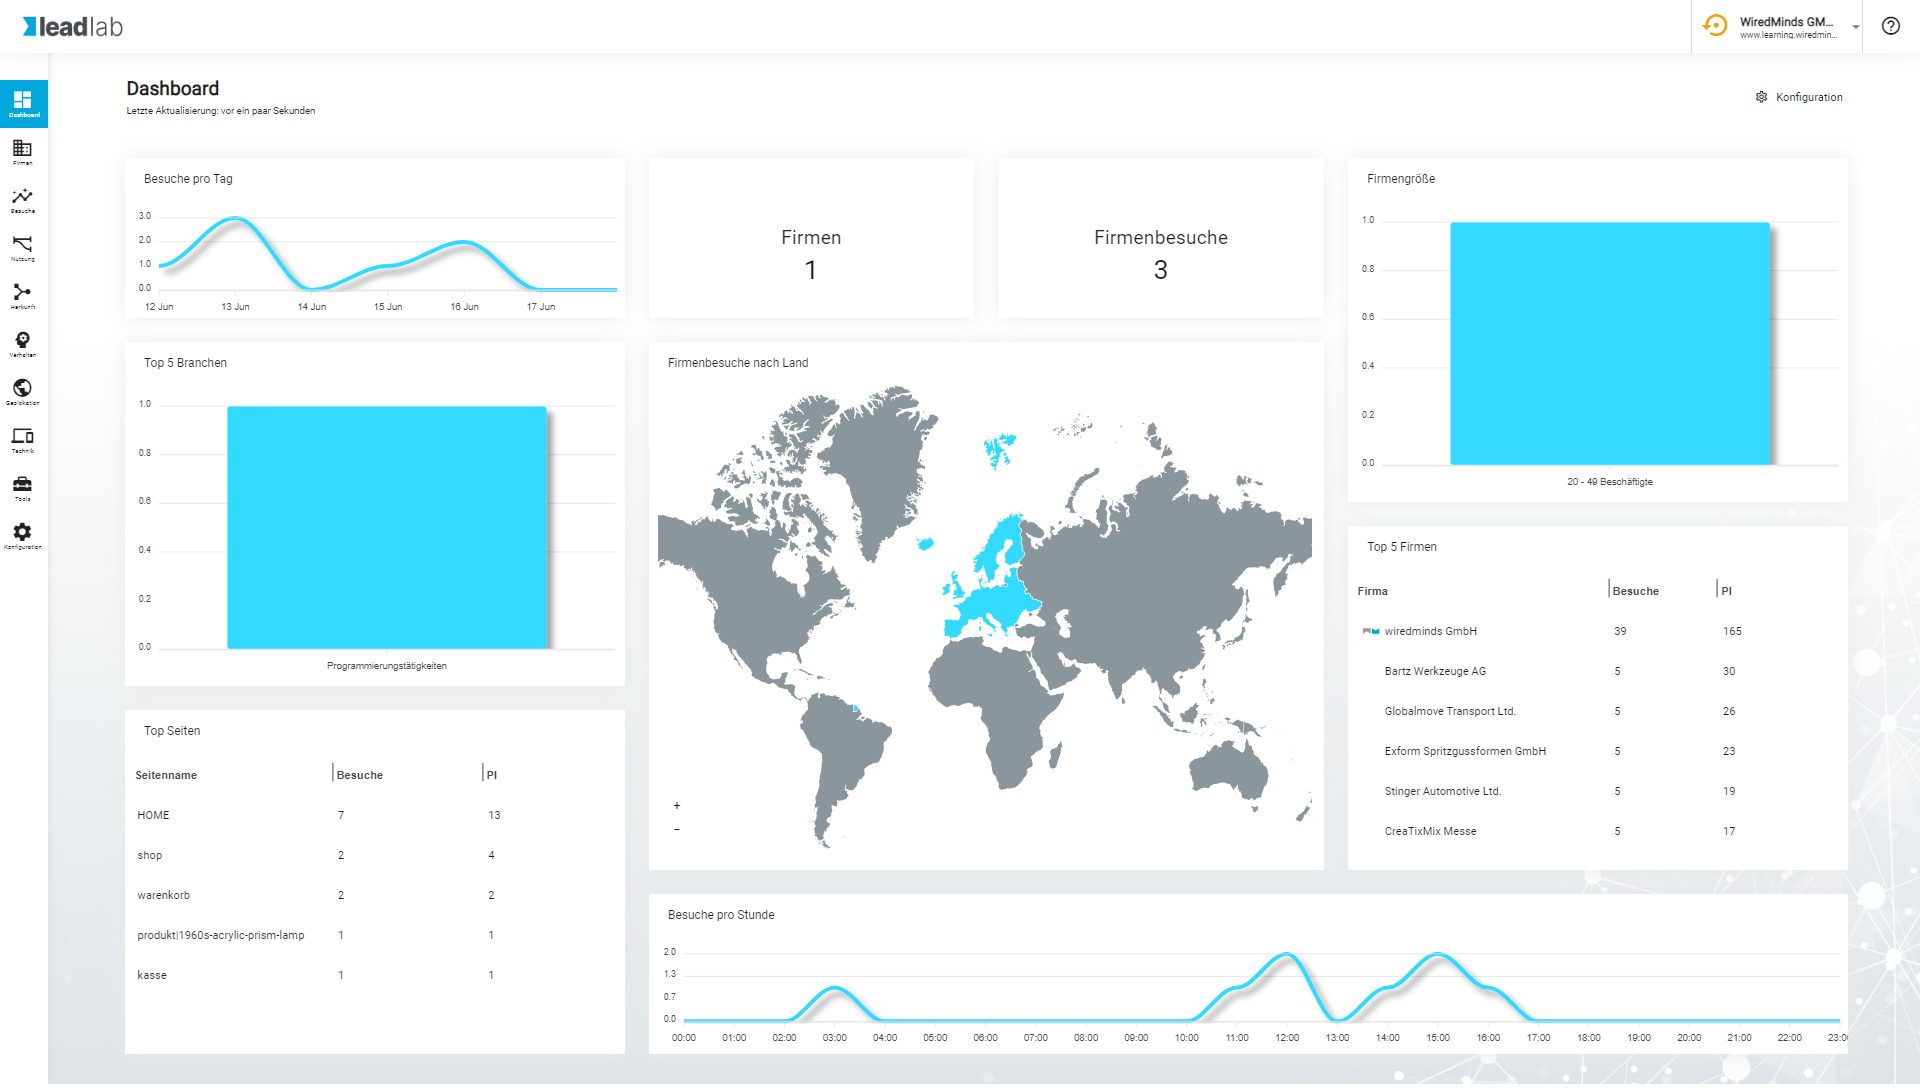
You can use the dashboard to display an overview of the measured values that are important to you at a glance.
Where can I find the dashboard
You can access the dashboard via the side menu | Dashboard. This is the top menu item.


How do I configure my dashboard?
In the edit menu, you can see the number of widgets currently created. You can also reset the dashboard to the default here using the Reset dashboard button.
To add a new widget, select Add widget. Configure your individual widget in the Edit widget window.
You have the following configuration options in the Edit widget window:
Widget name, period, filter, statistics, chart type.
With the Advanced settings button, you can further refine the chart by using individual metrics, dimensions, measured values and sorting. If the diagram texts are too long, you can hide the title bar and select whether the diagram label should be displayed.
Comparative values
Statistics in a chart can be compared with a previous period or with the same period in the previous year. To do this, select your desired interval in the widget configuration under Comparison period.