With the help of the heatmap, you can see how visitors use your website and thus gain insights for your marketing or optimize your pages.
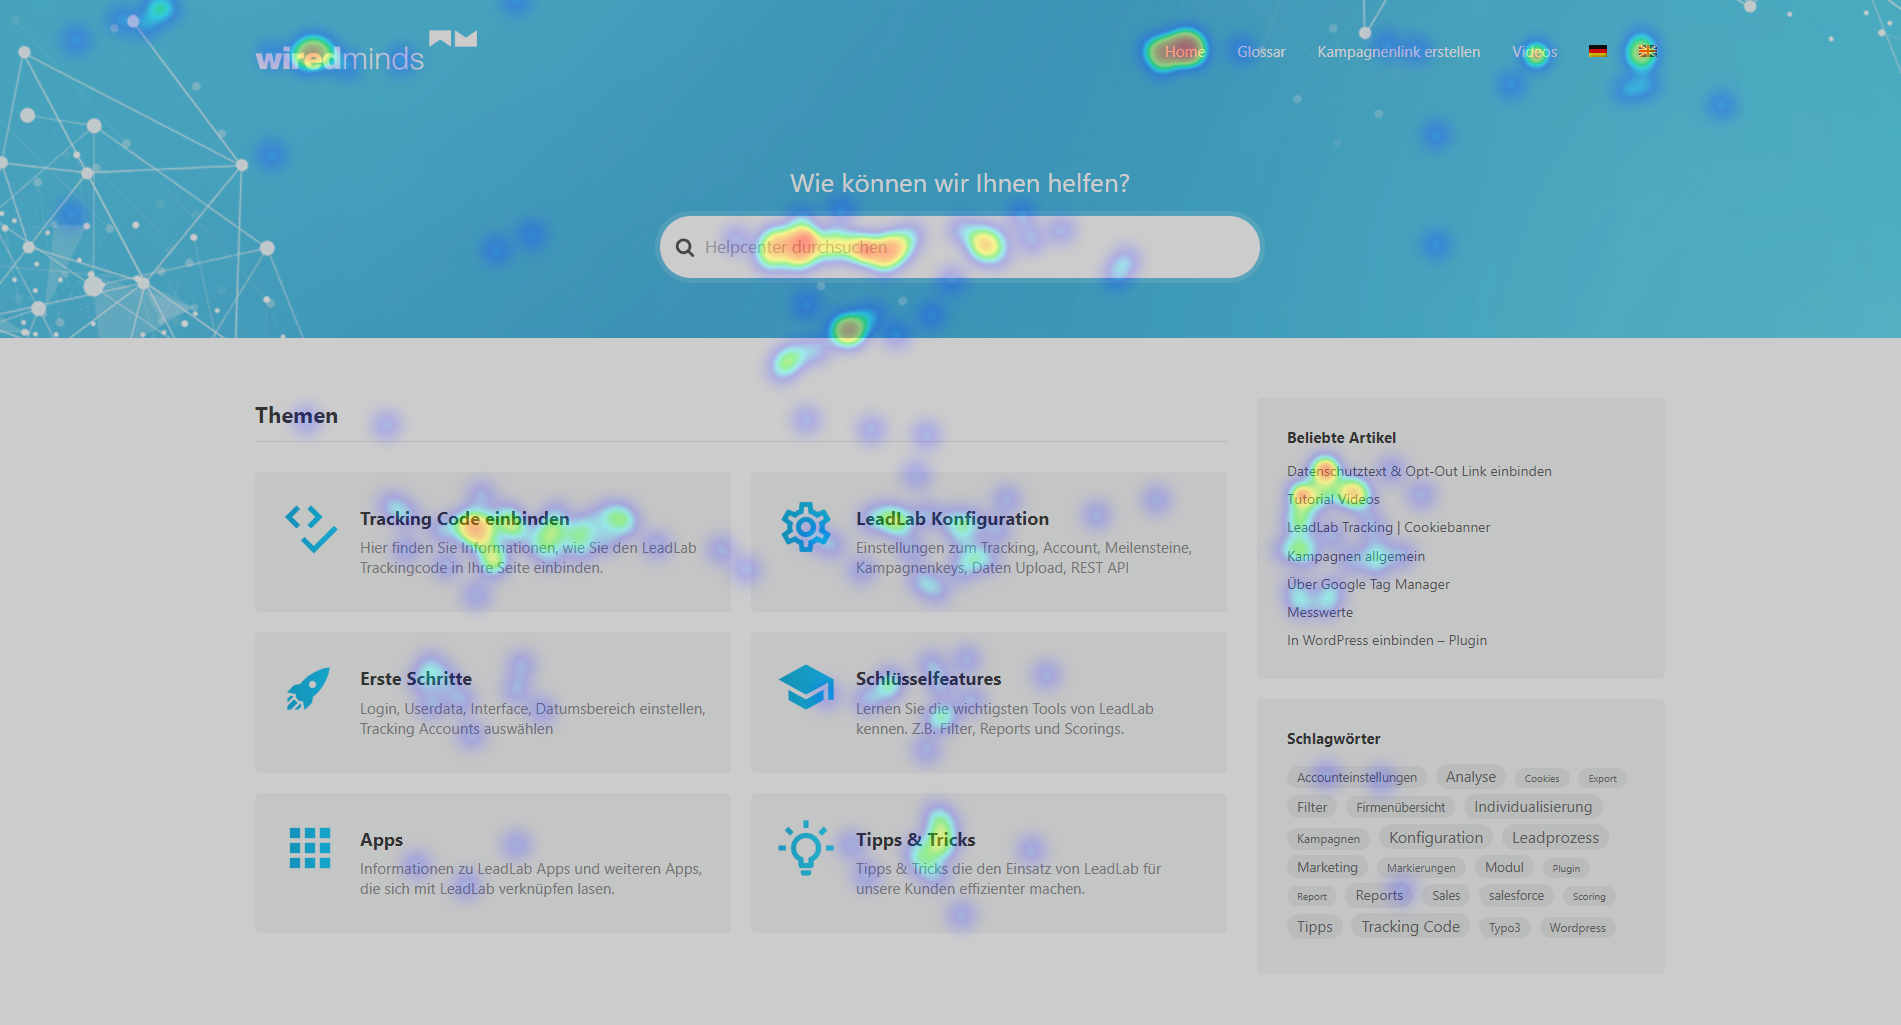
The hotter (orange / red) an area is displayed, the more often it was clicked on during this period.
Where can I find the menu for the heatmap?
You can activate the function via the side menu | Heatmap.
How do I activate the heatmap?
To activate the heatmap, copy the URL of the page you want to evaluate from the address bar of your browser and paste it into the “Paste URL for evaluation here” area. Select the desired time period that you would like to analyze and click on “Start heatmap”. A new tab should now open and an overlay should be displayed above your website.
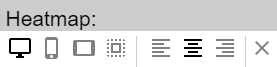
In order to obtain a correct display, make sure that the alignment of the heatmap is adapted to the navigation of your website. You can choose between left-aligned, right-aligned or centered. In the example above, the navigation is centered and the alignment of the heatmap is adjusted accordingly.