With the visitor flow statistics, you can graphically display the click behavior of your visitors starting from the entry page. (Sankey diagram)
Where can I find the visitor flow statistics?
You can view the visitor flow statistics in the side menu under Visitor flow.
What do the visitor flow statistics represent?
By default, the visits that are displayed in the visitor flow are evaluated based on origin. So you can see where visitors from which country have clicked. You can also change the analysis to campaigns, search engines or referrers here. The individual interactions are the subsequent clicks of the visitors.
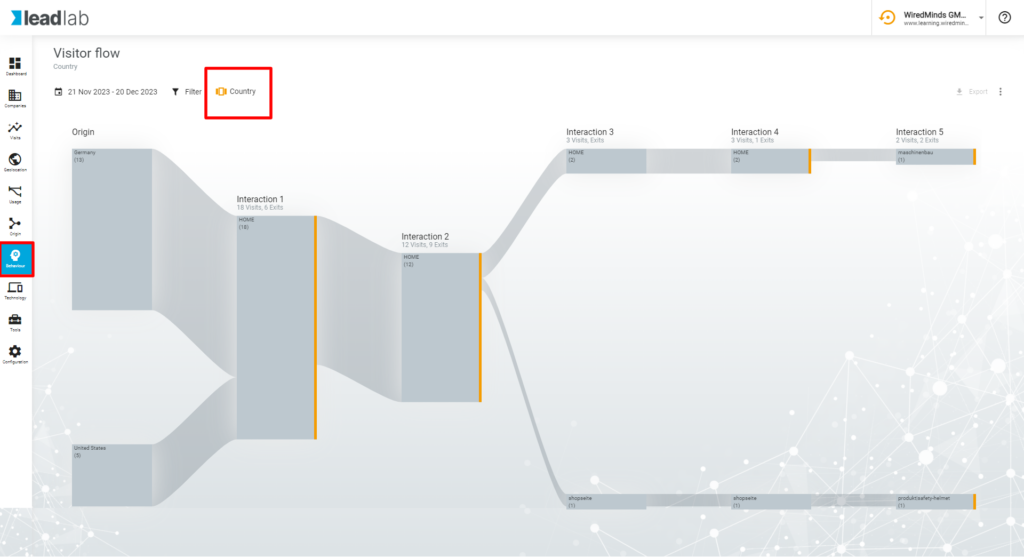
In the example above, 6 visitors have reached the Home page, followed by :
1 visitor canceled
1 visitor switched to the About us page
1 visitor switched to the Contact page
1 visitor switched to the product page and then to product A
The other 2 visits went to other pages that were grouped under the Rest node.
What setting options are there for the visitor flow?
In the top right-hand menu, you can access the settings by clicking on the symbol with the three dots. Here you can set the evaluation depth, the number of interactions and the click paths viewed.
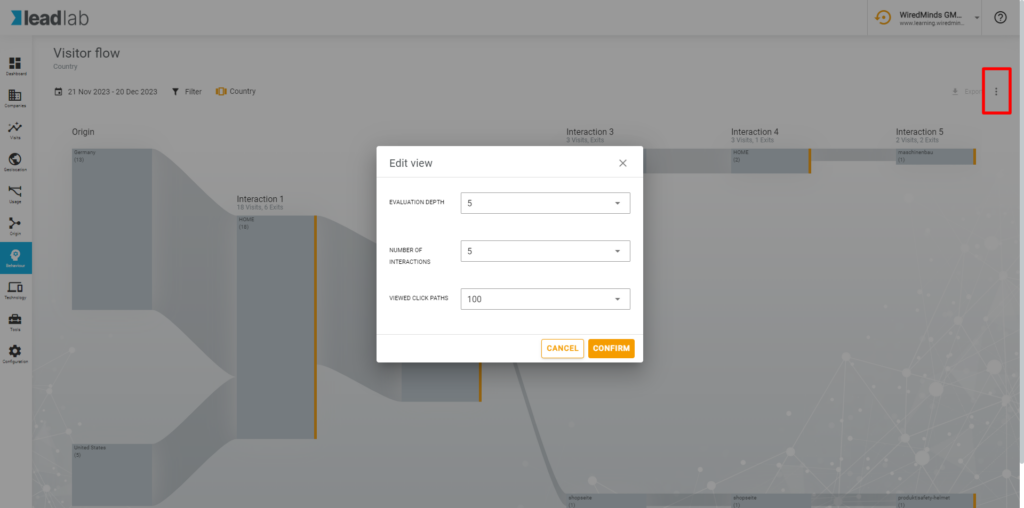
By setting the evaluation depth, you can set how many pages should be displayed per interaction. (Vertical number of nodes)
The number of interactions determines how many clicks should be displayed within a chain. (Horizontal representation of the nodes)
Change the number of click paths considered value to set the number of “top” click paths to be taken into account when creating the diagram.
How can a visitor flow be reported?
You can have the results of a defined click path sent to you by report. To do this, you must first select the desired click path. This is done by clicking on the connections between the nodes, which are then displayed in blue.
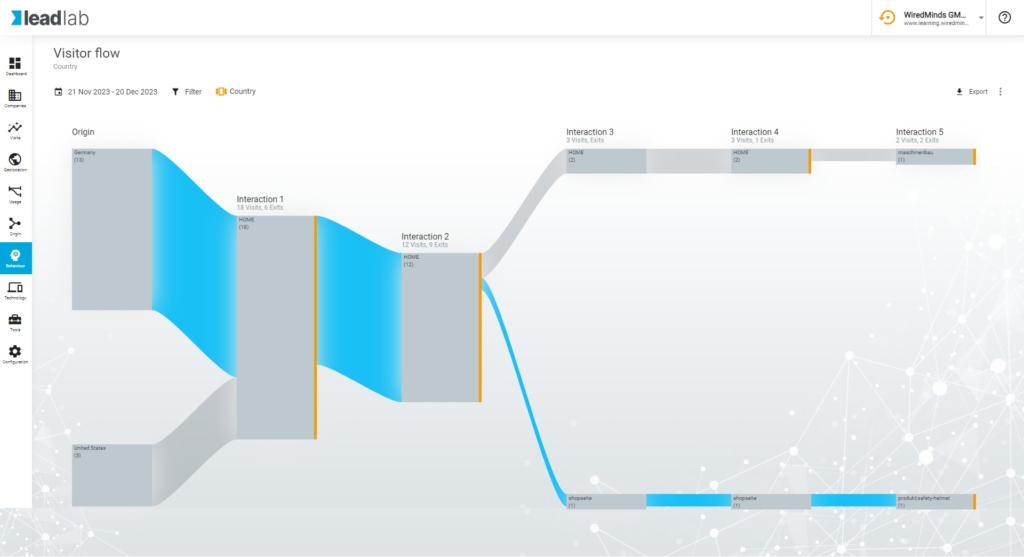
Here we select the path of all visitors from Germany from the HOME page, via products to product A. This tells us exactly how many visitors have chosen this click path. We can then create the desired evaluation in a report by selecting the “Create as new report” option (top right on the arrow symbol).
In order for a report to be sent with exactly this click path, a filter must exist that filters the pages and their position in the click path. In the next selection, all parameters are already preset for you and you only have to enter a meaningful name and select the statistics (visits per day, visits per week, etc.). You will then be taken to the menu for the report settings, which you enter as usual and then save the report.