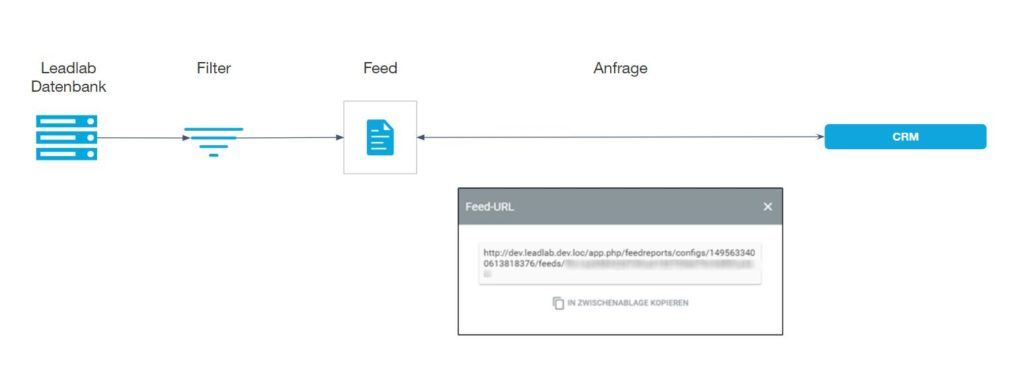
You can make all tracked data from your accounts available under one URL via a REST interface. This allows the data to be automatically transferred to your CRM system or a data visualization program, for example.
What possibilities does the interface offer?
With the Rest interface, LeadLab offers a technical interface for the automated processing of WiredMinds data. In this way, you can easily integrate your data directly into any system. This includes the data from the area of company identification, i.e. the identified company visitors and their click details, as well as the available statistics from the area of web analysis.
REST stands for REpresentational State Transfer. REST is a standard programming interface that is based on the specifications of the World Wide Web.
An application example for the wiredminds API is therefore the direct transfer of your recognized company visitors to the CRM system you use.
How do I activate the module for the data feed?
The module must be activated via WiredMinds support. As soon as it has been contractually agreed that the module can be released for you, you can have the module activated via Support. You will then find this under Additional Tools | API Feeds.
How can I test a feed?
Every customer has the opportunity to test the module to get to know how it works. A test can be requested at any time via Support. If you would like to request a test, you can do so by sending an e-mail to support@wiredminds.de.
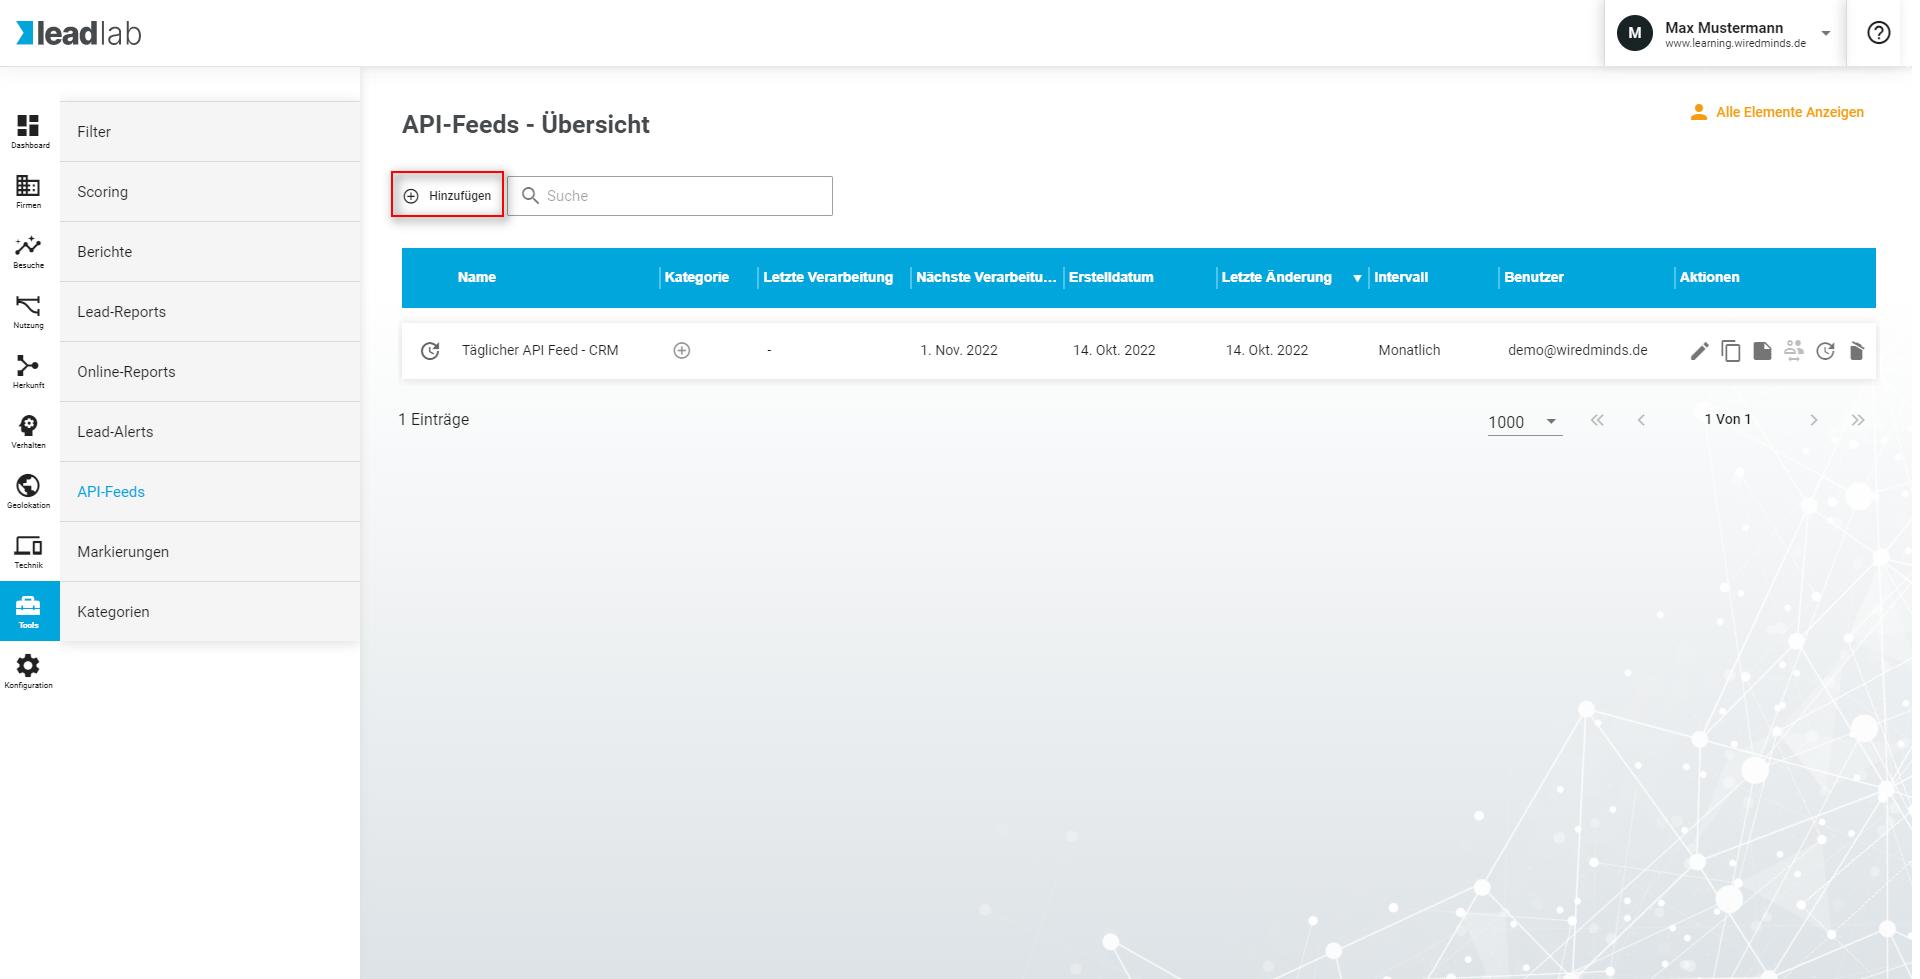
In the Tools | API-FEEDS area, you can create a new API feed by clicking on the blue plus symbol on the right-hand side.
How do I configure an API feed?
If you want to create a new API feed, simply fill in the relevant fields as required:
– Assign a meaningful name
– Choose between daily, weekly and weekly for the creation interval.
and monthly
– Decide on the desired language and select the desired statistics and the measured values that should be included (e.g. the company overview).
How can I view the feed?
To view an API feed and obtain the corresponding URL, click once on “Create report preview” and then on “Show feed”. You can use the feed metadata endpoint as a generic entry point and navigate from there to the other endpoints using the links provided. If you want to retrieve the data directly, use the feed data endpoint. If you paste this feed URL into the address bar of a browser, you can directly view the result as a JSON feed.
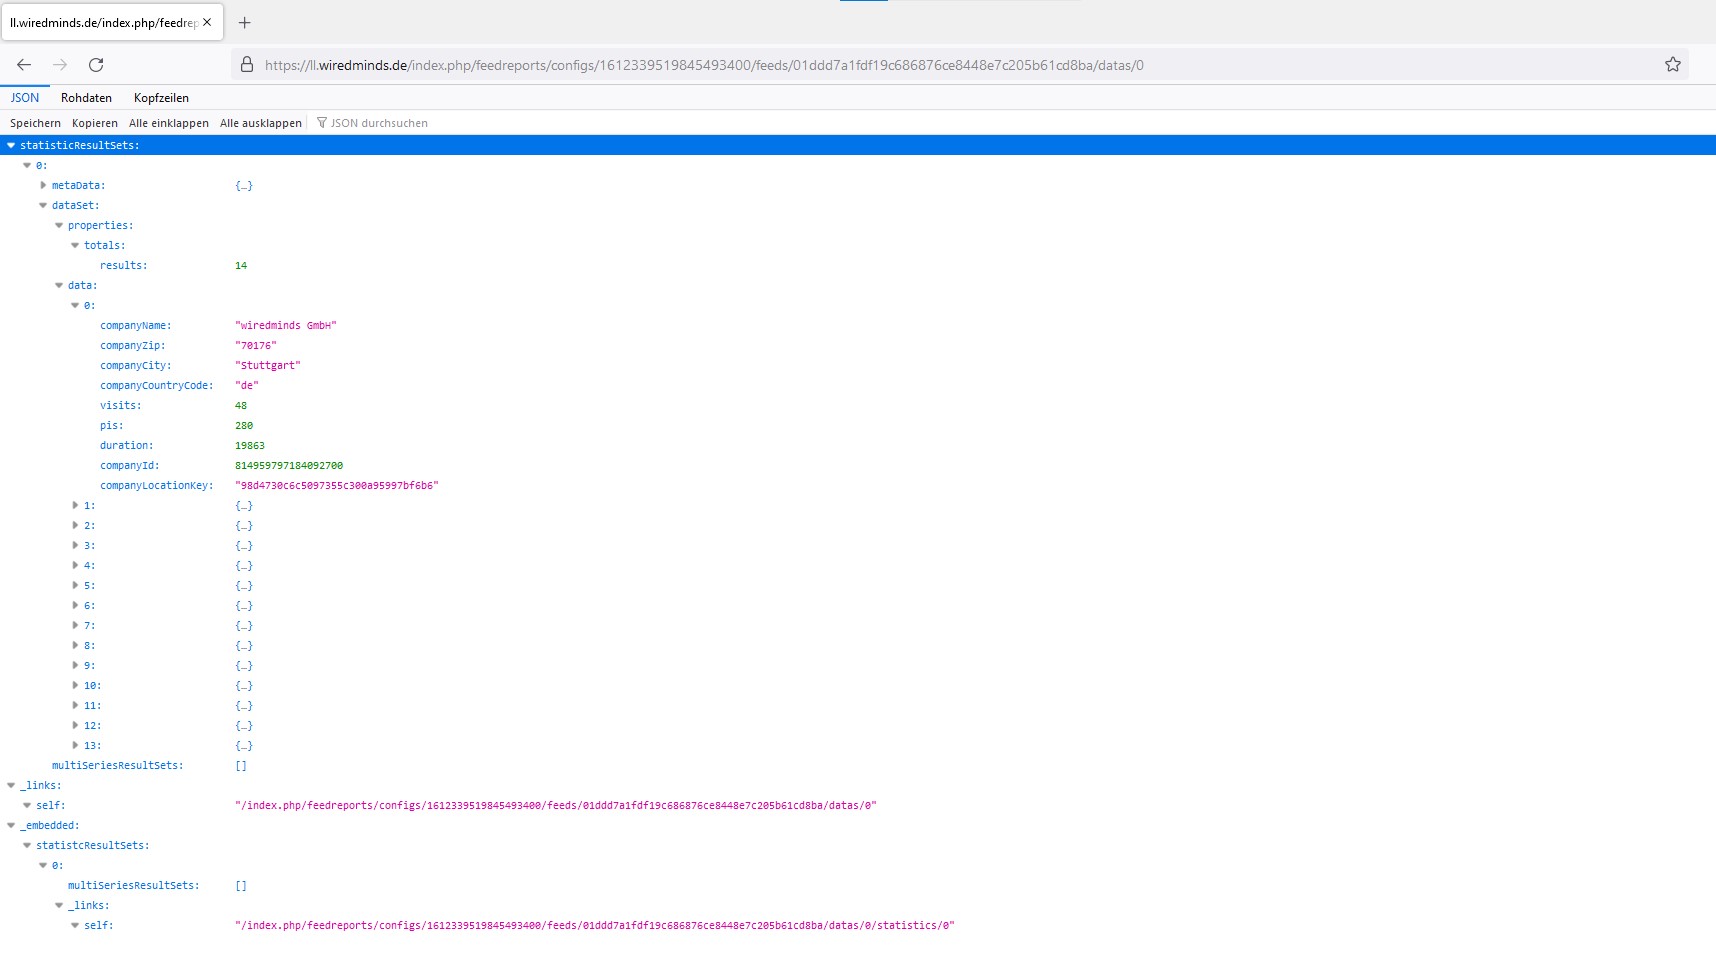
If you want to view the JSON data in a structured way, you can do this with the Firefox browser , for example!
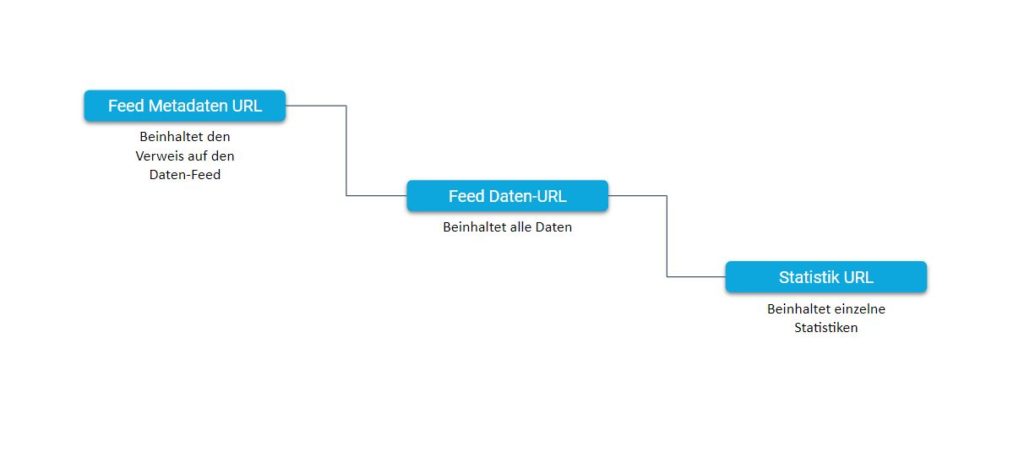
Data feed structure
The structure is divided into 3 resources, metadata, data and statistics. All resources can be accessed individually.